
UNIT-ECONOMICS GUIDE
Cloud-kitchen unit economics: connect each order to monthly break-even
A cloud kitchen may avoid a dining room, but it does not avoid unit economics. Delivery-platform charges, packaging, discounting and advertising can make the variable-cost structure unusually important. Build the model from one delivered order, then scale it to realistic capacity.
Start with average restaurant revenue per delivered order
Use delivered orders and restaurant-owned revenue under a documented definition. Separate cancelled or fully refunded orders because they can carry cost without normal revenue. Segment by brand or cuisine when their order values and recipes differ materially.
Worked monthly model
Assume average restaurant revenue is ₹500 per delivered order. Average food cost is ₹150, packaging ₹30, platform services ₹100, funded discounts ₹35, advertising ₹25 and refund or waste allowance ₹10. Contribution is ₹150 per order.
If monthly fixed cost is ₹300,000, simplified break-even is 2,000 delivered orders per month. At 30 operating days, that is about 67 orders per day. This result is meaningful only if the kitchen can deliver that volume at the assumed cost and quality.
| Per delivered order | Amount |
|---|---|
| Restaurant revenue | ₹500 |
| Food cost | −₹150 |
| Packaging | −₹30 |
| Platform services | −₹100 |
| Funded discount | −₹35 |
| Advertising | −₹25 |
| Refund/waste allowance | −₹10 |
| Contribution per order | ₹150 |
Add capacity and step costs
Break-even is not perfectly linear. At a certain daily volume, an additional cook, packing station or equipment shift may be required. Delivery delays can increase cancellations and reduce ratings. Model capacity bands: for example, up to 60 orders per day with the current team, 61–100 with an additional staff cost, and more than 100 with added equipment.
Separate peak capacity from daily average. A kitchen averaging 67 orders may still fail if 50 arrive in a two-hour dinner window and the line can process only 30.
Run sensitivity cases
Test at least four changes: a 5% fall in order value, a 3 percentage-point rise in food cost, a higher effective platform fee, and a lower organic share requiring more advertising. Small changes can shift break-even sharply because the denominator is contribution per order.
Also test improvement cases such as a better menu mix, lower packaging cost, reduced refund rate or higher add-on attachment. Avoid relying on one optimistic forecast.
Metrics worth reviewing weekly
- Delivered and cancelled orders by daypart.
- Restaurant revenue and contribution per delivered order.
- Food and packaging cost by brand or menu category.
- Effective platform-service cost as a percentage of defined revenue.
- Restaurant-funded discount and advertising per order.
- Refund, rejection and complaint rate.
- Order preparation time and peak-hour capacity utilisation.
- Repeat contribution when reliable cohort data is available.
CAPACITY CHECK
Test whether break-even volume is operationally possible
A spreadsheet can calculate a profitable monthly order count that the kitchen cannot produce at peak time. Convert monthly break-even into orders per open day and peak-hour throughput, then compare it with observed preparation and dispatch capacity.
| Constraint | Measurement | Warning sign |
|---|---|---|
| Prep station | Completed items per peak hour | Queue grows even when demand is stable |
| Cooking equipment | Usable batch capacity and cycle time | One item blocks several orders |
| Packing | Orders checked and sealed per hour | Prepared food waits for dispatch |
| Aggregator handoff | Ready-to-pickup waiting time | Delays create cancellations or quality loss |
| Demand | Delivered orders by 30-minute interval | Average demand hides an unserviceable peak |
Interpret the result
If break-even requires 70 orders per day but safe capacity is 55, price, mix, contribution or fixed cost must change before marketing more volume. If capacity is 100 but demand is 55, the decision is different: test acquisition economics without discounting below contribution.
Sources and further checks
- Contribution-margin guide — supplies the per-order contribution used in the break-even model.
- Campaign economics guide — tests whether demand acquisition improves contribution after spend.
Sources support the stated regulatory or methodological context. They do not determine the treatment of a particular outlet, contract or transaction.
Frequently asked questions
Is bank payout the same as revenue?
No. Payout is a cash settlement after multiple deductions, credits and tax movements. Revenue and contribution require consistent economic classification.
Should rent be divided per order?
You may divide fixed cost by volume for planning, but keep it separate from variable contribution so the break-even relationship remains visible.
Can multiple virtual brands share costs?
Yes, but use a documented allocation driver such as preparation time, labour hours, storage or delivered orders. Avoid arbitrary allocations that hide a weak brand.
PRACTISE WITH EVIDENCE
A beginner’s walkthrough: turn the monthly target into a decision
Gather the inputs before opening a calculator
Start with a normal operating month, not the best day in the launch week. Record how many days the kitchen was open, the orders actually completed, restaurant-owned revenue and the cost of producing those orders. Keep rent, the regular staff roster and other period overhead in a second list. The two lists answer different questions: whether an order contributes, and whether enough orders exist to support the kitchen.
A kitchen with several virtual brands should also record which brand used each ingredient batch, packaging type and constrained station. Shared purchasing does not mean every brand has the same economics. A curry brand and a sandwich brand may use the same premises but have very different portion costs and peak preparation times. If an allocation is approximate, write down the assumption instead of presenting it as a measured fact.
Recreate the ₹150 contribution example in the free tool
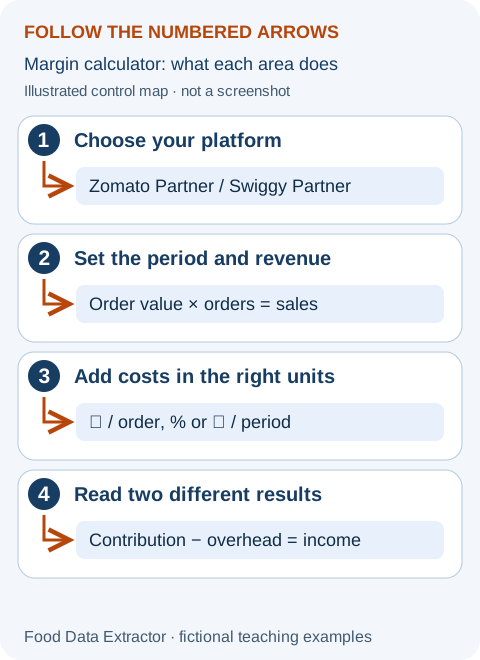
- Open the margin calculator and select the platform whose records you are reviewing. The selection labels the result; it does not fetch your agreement or automatically discover its fees.
- For this fictional scenario, enter average order value ₹500, 2,000 orders, food ₹150 and packaging ₹30 per order.
- Enter the example’s combined platform-services amount as ₹100 in fixed platform fee/order. Set commission and tax-on-commission percentages to zero only for this already-combined example, so the same service amount is not added twice. This is not a claim that services are tax-free.
- Enter restaurant discount ₹35 and advertising ₹25 per order, refund allowance 2%, and fixed overhead ₹3,00,000 for the same month. Set the remaining deductions and withholding to zero for this simplified case.
- The contribution should be ₹3,00,000 for the period: 2,000 × ₹150. Operating income should be zero after the entered ₹3,00,000 overhead. Follow the input-by-input manual when replacing the fictional amounts.
Ask what happens when the assumptions move
Now increase food cost to ₹160 without changing demand. Contribution falls to ₹140 per order, and the same 2,000 orders produce only ₹2,80,000. The model shows a ₹20,000 operating loss. Break-even becomes ₹3,00,000 ÷ ₹140, or about 2,143 orders after rounding up. Across 30 open days, that means roughly 72 orders a day. Compare that requirement with safe, observed capacity before increasing advertising.
A positive contribution is not permission to chase unlimited volume. If an extra shift costs ₹30,000, re-enter period overhead before estimating profit at the higher order count. Likewise, a single average can hide a weak low-value brand. Run brand-level scenarios, reconcile the combined totals, and record the largest uncertainty beside the result.
What to do on Monday morning
Choose one controllable question: ingredient yield, packaging, funded discount, opening reliability or the bottleneck. Assign an owner and review the next comparable week. Use the weekly review to connect that change with stock, waste and service quality. The calculator is a planning aid, not a demand forecast or a guarantee that a kitchen can fulfil its break-even volume.
Walkthrough and arithmetic checked 3 October 2026. The complete beginner tool manual explains controls, units, privacy and access limits. Examples are invented and are not platform rates or restaurant results.
Illustrative business education, not financial advice. Replace all example inputs with actual outlet data.