
US & CANADA · RESTAURANT OPERATIONS
Actual vs Theoretical Food Cost: Investigate Restaurant Variance
Calculate actual and recipe-based food consumption with a fictional USD/CAD restaurant example, a local variance calculator and checks for stock, units, waste and recipe changes.
Independent educational guide. Examples are invented and independently calculated, not results from a real restaurant. Contract, accounting and jurisdiction-specific questions need the appropriate professional or official provider.
Choose a section in this guide
A difference is a question to investigate, not a verdict
Actual food consumption measures what left the defined stock pool during the period. Theoretical consumption estimates what the recorded sales would have used under the chosen recipes and portion standards. Their difference helps an owner identify where evidence needs attention. It does not by itself prove waste, theft, poor staff performance or an incorrect supplier invoice.
This guide adds an inventory-variance workflow to our existing food-cost and recipe-pricing guide. It uses fictional USD and CAD amounts and deliberately separates the arithmetic from the diagnosis. A perfect-looking ratio can still be wrong if stock units, sales scope or recipes are inconsistent. A negative variance can also occur because the underlying evidence is incomplete or the theoretical assumptions do not match current practice.
Choose one location, one period and one inventory category before starting. Keep food, beverages and packaging scopes consistent, or show them separately if your policy does so. Value opening and closing stock on a documented basis and record transfers explicitly. Do not quietly change the denominator or the included categories between weeks merely to make the result resemble an external benchmark.
Build actual and theoretical consumption from different evidence
For the simple no-transfer case, actual consumption is opening stock plus received purchases minus closing stock. Purchases must belong to the period and the stock pool being counted. A late invoice is not necessarily a late receipt. If stores exchange ingredients, add incoming transfers and subtract outgoing transfers using their documented values; a transfer changes location scope, not total group consumption.
The theoretical figure comes from item quantities sold and their standard recipe costs, including the modifiers and sizes that affect usage. Use the recipe version valid during the period. A current recipe sheet cannot explain past sales correctly if portions or supplier pack sizes changed halfway through the week. Make sure the sales quantities correspond to the same location and dates as the stock records.
Record known staff meals, samples, complimentary products and other non-sales use separately. If theory includes only sold meals while actual includes every stock use, part of the gap is a scope difference rather than an unexplained loss. Waste logs can explain some consumption already included in the actual figure; do not subtract them a second time and then claim the remaining number is a clean measure of operational success.
A fictional USD 1,200 variance
For an invented period, opening food stock is USD 5,000, purchases received are USD 8,000 and closing stock is USD 4,000, with no transfers in this scoped exercise. Actual consumption is 5,000 plus 8,000 minus 4,000, or USD 9,000. Recipe-based theoretical consumption for the recorded sales is USD 7,800. The monetary difference is therefore USD 1,200.
If restaurant revenue for the same scope is USD 30,000, actual consumption is 30% of that revenue and theoretical consumption is 26%. The difference is four percentage points. It is not four percent of the theoretical cost: 1,200 divided by 7,800 is a different comparison. Use the calculator defaults to reproduce the USD 9,000 actual amount, USD 1,200 variance and the two revenue-based percentages.
Suppose the evidence pack explains USD 300 of measured waste and USD 200 of approved non-sales meals already included in actual consumption. That leaves USD 700 to investigate against the chosen theoretical scope. This remainder is not automatically theft; it can involve count errors, recipe yields, substitutions, modifiers or other missing evidence. In a separate CAD case, use the actual CAD stock valuations and recipes; selecting CAD changes the label, not the original amounts through exchange conversion.
Work from counting and units toward operating causes
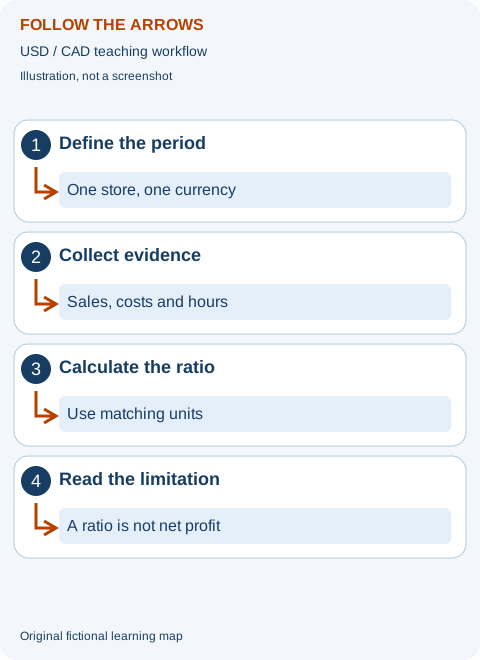
First repeat the inventory boundary checks. Did the closing count include every relevant storeroom and refrigerator? Were partly used packs measured consistently? Did a delivery arrive before the count but get recorded after it? Check the physical unit, purchased pack size and recipe unit before deciding the kitchen used too much. Confusing a case, kilogram and portion can create a larger variance than any genuine operating issue.
Then check recipe and sales scope. A meal with an extra topping should not use the unmodified base recipe in theory. A substituted ingredient may have a different cost or yield. A voided order, a prepared remake and a completed sale can affect kitchen consumption differently; use the transaction's documented status and the physical outcome. Keep a clear explanation rather than forcing every event into the same sales quantity.
Only after those checks should you investigate portion consistency, spoilage and production practice. Observe a measured preparation batch, compare yield with the written standard and discuss the process with staff without treating the spreadsheet as an accusation. Food safety and required storage practices remain guardrails. Never retain unsafe stock or reduce necessary hygiene practices to improve a financial percentage.
Create a repeatable variance review
Choose a practical count schedule and train the people using it. Retain a versioned recipe list, inventory sheet, supplier receipt record and scoped item-sales report. Mark provisional figures until the necessary records are complete. Compare repeatable periods rather than a partial trading week with a complete month. If a correction materially changes a prior result, preserve the old version and document the reason.
For one controlled improvement, select a specific evidence-backed cause and a small measurement plan. A portion test might measure ten representative servings against the recipe standard while monitoring customer satisfaction. A receiving test might check pack quantities and invoice mapping. Define what evidence would confirm the issue has improved, and separately check that the intervention did not damage quality, safety or service.
The calculator cannot assess whether an inventory valuation policy is appropriate, read a kitchen's stock count or identify a real cause from five totals. Negative actual consumption is rejected as a scope/count problem; negative variance is permitted because it can be a legitimate signal to investigate. Use the result as an evidence question, not a certified accounting adjustment or an instruction to discipline staff.
Prepare a count that a new team member can repeat
An inventory count is not simply a walk around the kitchen with a clipboard. Decide which rooms, ingredients and partly prepared products belong to the scope. Write the unit next to each line before anybody starts. A bag, a case and a kilogram are not interchangeable. Count the same categories at the start and end of the period. If one count includes the freezer and the other forgets it, the formula can be correct while the conclusion is wrong.
Create a route through the storage areas in a fixed order. This helps avoid counting an item twice or missing a shelf. Mark unopened packs separately from partly used packs and use a documented practical measurement method. Do not guess a half pack differently each week without noting the uncertainty. If an item is difficult to measure, identify a suitable method and train the people using it. Financial review must never interfere with safe handling or storage.
Choose a quiet, consistent count boundary where practical. Record whether deliveries or production occurred during the count. If stock moves while two people are counting different areas, keep a movement note. The closing count of one period should connect to the opening count of the next unless a documented adjustment explains the difference. A count time is part of the evidence, not merely a scheduling detail.
For a fictional café called Orchard Counter, the count sheet lists dry storage, cold storage, freezer and prepared components. A trainee follows the route and initials completed areas. A reviewer checks a few high-value items and unusual changes. The initials indicate responsibility, not proof of perfection. The owner should still mark uncertain measurements as estimates and investigate material differences. A repeatable count is more useful than an apparently precise number assembled from inconsistent guesses.
Pack sizes and recipe units: a detailed beginner exercise
Suppose an invented supplier case contains six two-kilogram packs and costs sixty dollars. The case contains twelve kilograms, so the simple purchased cost is five dollars per kilogram before any other relevant treatment. A recipe uses two hundred grams, which is one-fifth of a kilogram. That ingredient portion costs one dollar on this basis. Entering two hundred as kilograms or treating one case as one kilogram would create a very large error.
Write the conversion in words: case to packs, packs to kilograms, kilograms to grams and grams to portion. Keep purchased weight and usable weight distinct. If preparation removes material, the usable cost can differ from the purchased cost. Do not multiply by a yield percentage when you should divide by it. Use a measured representative process and state assumptions rather than copying a universal yield from a recipe blog.
For another fictional exercise, ten kilograms purchased for fifty dollars produces eight kilograms of usable ingredient. Usable cost is six dollars and twenty-five cents per kilogram. A two-hundred-gram usable portion then costs one dollar and twenty-five cents. This original arithmetic assumes the measured eight-kilogram result and excludes other processing costs. It is not a recommended portion, safety procedure or industry-standard yield.
Now imagine the supplier changes the case to five packs while the purchasing sheet still assumes six. The invoice price alone does not reveal the true cost change. Recheck quantity and pack size, not just price. Date the revised conversion and recipe cost. A receiving check that catches this change can prevent weeks of misleading theory. Explain the correction to the person maintaining recipes so stock records and recipe records use the same physical units.
Receiving dates and invoice dates do different jobs
Actual consumption needs purchases received in the selected stock scope. An invoice arriving later does not necessarily mean the food arrived later. Keep the receipt date, quantity and relevant invoice reference. If a delivery arrives before the closing count but is omitted from purchases, the model may understate consumption. If it is included as a purchase but arrives after the count, the model may overstate the selected period. The physical boundary and accounting policy need to be understood together.
In an original fictional week, opening stock is twelve hundred dollars, received purchases are two thousand dollars and closing stock is nine hundred dollars. Simple actual consumption is twenty-three hundred dollars. A four hundred dollar delivery received during the week but missing from the purchase record would make the preliminary calculation nineteen hundred dollars. That four hundred difference is a recording issue before it is an operational conclusion.
Keep disputed deliveries separate from unsupported adjustments. A supplier credit may correct quantity or price, but you need to know what it refers to. Do not subtract an estimated credit just because the team believes some produce was unacceptable. Follow the business's receiving, safety and accounting procedures. Record confirmed quantities and legitimate supporting documents. A cost worksheet is not permission to use unsafe stock or alter an invoice.
Reconcile the receipt log to the purchase evidence before blaming portions. A simple review can list delivery date, stock category, quantity, valuation and document status. Mark provisional amounts clearly. When the final invoice arrives, preserve the earlier version and explain the change. This lets the owner distinguish an updated source amount from a genuine change in kitchen consumption.
Theoretical usage needs the recipe used at the time
A theoretical cost is an estimate based on the selected recipe and recorded item quantities. It does not become truth merely because it is calculated to two decimal places. The recipe must reflect portion sizes, ingredients, modifiers and preparation yield for the period being reviewed. An old recipe and a new menu can create an unexplained-looking variance without any actual misuse of stock.
Consider a fictional soup recipe that changes halfway through a week. The first hundred portions have a standard ingredient cost of two dollars each. The next hundred use a revised recipe costing two dollars and forty cents. Correct theoretical cost for the two groups is four hundred and forty dollars. Applying only the new recipe to all two hundred portions gives four hundred and eighty; applying only the old recipe gives four hundred. Neither matches the documented mixed period.
Maintain a recipe version date and a plain note about the change. The owner does not need a complicated system to begin. A list of effective dates, portion assumptions and supplier conversions can be enough if it is consistently used. Keep changes to size, sauce and paid extras visible. A small modifier may materially change cost when sold often. Do not apply the base recipe to every variant without checking.
Also distinguish a recipe cost from a selling price. A promotional price change does not by itself change physical ingredient use. A portion change does. Comparing theory and actual consumption should focus on compatible stock and recipe definitions, while contribution analysis adds revenue and other relevant costs. Keeping these methods distinct makes both easier for a beginner to understand.
Staff meals, samples, remakes and other non-sales use
Food can leave stock without appearing as an ordinary sale. Staff meals, samples, authorised complimentary meals, remakes and measured waste may be part of the actual stock consumption. If theory covers only sold items, those events explain part of the gap. Record them according to a consistent business policy. Do not quietly exclude them one week and include them the next to improve the ratio.
In an invented exercise, actual consumption is three thousand dollars and sales-based theory is twenty-six hundred dollars. The four hundred gap includes one hundred and twenty of authorised non-sales meals and eighty of measured waste already consumed. The remaining unexplained amount is two hundred. This is an explanatory bridge, not a second consumption calculation. The known two hundred should not be subtracted from actual consumption and then also added to theory without a clear model definition.
Remakes deserve their own explanation. An order sold once but prepared twice uses more ingredients than the single sales recipe. The operational reason may be a preparation problem, a ticket misunderstanding or something else requiring investigation. A remake log should connect the event to a business reference and actual food outcome. It should not expose unnecessary customer details or assign fault without evidence.
Use the log for learning. If a particular modifier repeatedly needs remaking, clarify the ticket or recipe. If samples are intentional marketing, assess their cost separately. If staff meals are authorised, include a consistent policy rather than treating them as an unexplained loss. A fair, accurate scope helps the owner take useful action instead of treating every difference as wrongdoing.
Transfers between stores: consumption moves differently from ownership
A transfer of stock between two locations changes where the stock sits, not necessarily how much the whole group consumed. For a location-level calculation, include documented incoming and outgoing transfers. For a group calculation, internal transfers should not become new external purchases or extra group consumption. Keep the transfer date, item, quantity and valuation basis. Both locations should agree on the same record.
For an original fictional example, Store North has opening stock of one thousand dollars, received purchases of fifteen hundred, incoming stock of two hundred, outgoing stock of one hundred and closing stock of eight hundred. Location consumption is eighteen hundred dollars. If incoming and outgoing transfers were ignored, the simple calculation would show seventeen hundred. That difference comes from scope, not necessarily a kitchen problem.
Store South records the corresponding transfer on its own scope. An internal movement should not be valued differently merely to make one store appear better. Appropriate accounting policy determines valuation, but the management record should be consistent and traceable. A group-level report can eliminate the internal movements while still retaining the location trail for investigation.
Ask the receiving location to confirm the quantity when the movement happens, not weeks later from memory. Partly prepared components also need clear units and recipes. A tub without a documented weight can make both counts uncertain. Transfers are often operationally convenient, but without evidence they can create misleading variance at both stores. The solution is a small reliable movement record, not an accusation based on the final ratio.
A negative variance is possible and needs investigation
Toast's article is useful for the general actual-versus-theoretical distinction, but a blanket statement that actual always exceeds theory should not replace evidence. A negative difference can occur in a management model because of count errors, recipe assumptions, substitution costs or scope. It does not prove the kitchen has achieved impossible efficiency or that the restaurant should reduce its stock records. Read the result as a question.
Suppose a fictional actual calculation is twenty-five hundred dollars and theory is twenty-eight hundred. The difference is minus three hundred. First recheck closing stock and receipt boundaries. An overstated closing value reduces actual consumption. Next examine recipe costs and modifiers. Theory may use a more expensive ingredient than the one actually used. Also check whether all sales are within the same location and period.
If the evidence supports a genuine difference, explain its cause rather than forcing the result to zero. A cheaper approved substitute may reduce cost while preserving the intended recipe and quality, but changes need proper documentation. Underportioning might reduce consumption but harm the promised customer product. A lower cost figure is not automatically a successful outcome. Safe preparation and accurate menu fulfilment remain guardrails.
Do not erase a negative result because it looks unusual. Preserve the first calculation and the revised evidence if a correction changes it. A reviewer should understand both versions. A credible guide teaches how to handle uncertainty and exceptions, not only the neat positive example that fits an expected story.
A measured portion study that does not blame the team
A portion study compares observed servings with the documented standard. It should be a learning exercise, not a surprise accusation. Explain the purpose, choose a representative preparation period and use suitable measurement methods. Never interrupt required hygiene or temperature controls for a financial test. The recipe standard must itself be appropriate for the product promised to customers.
For an original fictional exercise, the standard is one hundred grams of an ingredient per portion. Ten representative portions together use one thousand and one hundred grams. The observed average is one hundred and ten grams. At five dollars per kilogram, the extra ten grams costs five cents per portion under these assumptions. At one thousand comparable portions, the simple modelled difference is fifty dollars. This does not establish that all future portions behave identically.
Before changing behaviour, ask why the difference occurs. The measuring tool may be inconsistent, the recipe may be outdated or the written portion may not match the actual product. A discussion with the kitchen can reveal these practical issues. Do not assume an employee is careless merely because the average differs. Check the method and compare several representative batches.
If a clear improvement is made, track quality and fulfilment as well as cost. A smaller portion that contradicts the advertised dish is not an acceptable financial success. Record the change, the next measurement period and what would count as evidence of improvement. A useful cost-control guide keeps the customer promise and staff understanding inside the decision.
Correct a count without rewriting history
An error found later should have a clear correction note. Record the original amount, corrected amount, reason, source and date. Do not silently edit last week's closing stock and pretend the first review was correct. A previous closing count can affect the following opening count, so trace both periods. Correcting one without the other may create a new apparent variance next week.
Suppose a fictional closing stock value of nine hundred dollars omitted a freezer item worth one hundred. Correct closing stock is one thousand. With opening stock twelve hundred and purchases two thousand, actual consumption falls from twenty-three hundred to twenty-two hundred. If the next period's opening count originally used nine hundred, it also needs to be connected to the corrected evidence according to the review policy.
Separate a counting correction from a changed valuation assumption. If unit prices are revised, document why and apply the appropriate policy consistently. Do not selectively revalue only the items that make the result more attractive. The public calculator performs arithmetic; it cannot assess inventory valuation or decide which accounting adjustment is appropriate.
A review log lets the owner see whether repeated errors indicate a process problem. If the same storage area is often omitted, improve the count route. If partly used packs are inconsistent, train the measurement method. The correction is not a failure to hide. It is evidence that the process should become clearer.
Use the free variance calculator as a learning tool
Start with the fictional defaults already on this page. Opening stock, purchases and closing stock describe the same no-transfer scope. Theoretical consumption comes from recipes and sales, while revenue is the same-period denominator. Calculate once and explain why actual is nine thousand, theory seventy-eight hundred and variance twelve hundred. If you cannot explain the relationship, do not replace all the values with business data yet.
Next change closing stock from four thousand to forty-five hundred while leaving everything else unchanged. Actual consumption becomes eighty-five hundred and the monetary variance becomes seven hundred. The change does not prove the kitchen saved five hundred dollars. It may simply reflect more stock still on hand, or a different count. The model responds to the entered evidence; it does not diagnose what happened physically.
Try a negative variance with a supported fictional combination. The model permits a negative gap because it can be meaningful to investigate. Negative actual consumption is a separate warning about impossible or inconsistent inputs in this simple scope. If your real case includes transfers, the five-field model is incomplete. Use a properly documented external worksheet for those movements rather than disguising them as purchases without explanation.
Choose USD or CAD only to label amounts already expressed in that currency. The selector does not convert money. Inputs are calculated in the page and do not connect to a POS, stock system or delivery dashboard. No result is saved after reload. Record real evidence in your own secure business process, and do not upload private exports to an unsupported parser.
Interactive questions: decide which evidence comes next
Actual cost rose but the supplier price did not. What should I check?
Inspect receipt and count boundaries, recipe versions, product mix, modifiers and known non-sales use. Stable supplier prices do not mean the physical quantity or menu mix stayed unchanged. Check those possibilities before assigning an operating cause.
A waste log explains two hundred dollars. Should I subtract it from actual and add it to theory?
Not without a clearly defined model. Waste already consumed is inside actual usage. A bridge can explain part of the gap, but moving it on both sides can double-count the explanation. Write which comparison you are making and retain the original actual calculation.
The gap fell after a portion change. Did the change definitely work?
Not by itself. Counts, receipts, menu mix and other events can differ. Check representative portions and customer fulfilment, then compare compatible periods. A cost reduction that harms safety or the promised product is not a successful improvement.
Run a short weekly meeting that leads to one action
Begin with evidence completeness. Are the counts, receipts, transfers, sales quantities and recipe versions available? Mark the result provisional if important sources are missing. Next explain the monetary gap and the revenue-based percentages. Then identify known non-sales use and remaining questions. Do not begin the meeting by demanding a perfect percentage from staff who have not seen the definitions.
Choose one specific issue supported by evidence. A missing freezer area calls for a clearer count route. A changed pack size calls for a purchasing conversion update. A confusing extra calls for a recipe and ticket review. Each action should have a responsible person and next check. Avoid making several unexplained changes merely to reach an external benchmark.
Keep a concise conclusion with what was checked, what changed, what remains uncertain and what happens next. A new manager should be able to read it and repeat the process. The inventory-variance method is most valuable when it improves the restaurant's understanding, not when it produces a dramatic claim about theft or savings that the evidence does not support.
A batch-preparation example: count the component only once
A kitchen may transform raw ingredients into a sauce or prepared filling that remains in stock. Decide how the count values those components so the same material is not counted twice. If ingredients have been used to make sauce, they should not also remain as untouched raw stock in the closing count. A documented preparation record and component recipe help connect the physical product to its value. Appropriate accounting policy still matters; the worksheet does not choose it for you.
For an original fictional exercise, ingredients costing sixty dollars are used in a sauce batch. The measured usable batch is six kilograms on this simplified basis, making its ingredient cost ten dollars per kilogram. Two kilograms remain at the closing count and represent twenty dollars of included component stock. If the count also leaves the full sixty dollars of raw ingredients recorded as unused, closing stock is overstated. If it omits the remaining sauce entirely, closing stock is understated. Both distort apparent consumption.
Keep batch and portion units connected. A serving using fifty grams of the sauce has an ingredient cost of fifty cents under the invented assumptions. A sales-based theoretical recipe should include that component appropriately without separately adding its full raw recipe again. The owner should be able to follow the recipe from purchased ingredients to usable batch to served portion. This is clearer than an unexplained composite cost entered by memory.
If measured yield varies, investigate the process and measurement method. Do not automatically force every batch to the expected weight. Safe preparation can involve unavoidable changes, and usable yield needs to reflect the actual product. A lower yield is not automatically staff wrongdoing. Note the batch, assumptions and relevant evidence, then select a proportionate practical review.
Choose a revenue denominator that matches the stock question
The denominator is the number you divide by. A food-cost percentage can be misleading when food consumption is divided by a revenue total containing unrelated activity or an inconsistent tax basis. Write exactly which sales are included. If beverages are separately counted and costed, decide whether the comparison is food-only or all included goods, and keep that policy consistent. Do not select whichever denominator makes the result look best.
Suppose an invented café has food consumption of three thousand dollars, food revenue of ten thousand and separately scoped beverage revenue of five thousand. Food consumption divided by food revenue is thirty percent. Dividing it by combined revenue gives twenty percent, but that figure answers a different question unless beverage costs and scope are appropriately included. Neither arithmetic is mysterious; the issue is whether the relationship being reported is meaningful.
A complimentary meal consumes food while bringing no corresponding sale. It belongs in the explanatory scope rather than being given invented revenue to improve the ratio. Tax collected for others and tips also need consistent appropriate treatment. Ask the bookkeeper about the reporting basis if the source sales total is unclear. A percentage to two decimals cannot compensate for a poorly defined numerator and denominator.
Finish the review by saying the scope aloud: included food consumption for this restaurant and period divided by the matching revenue basis. If the sentence sounds vague, improve the definitions before interpreting the result. This is a simple teaching habit that helps a new owner recognise why two accurate reports can still produce an invalid comparison.
Know when the simple review needs help
If stock valuation, tax treatment, inter-company transfers or payroll accounting affects the result, obtain appropriate professional advice. The teaching model cannot determine those policies from totals. If the count process repeatedly produces physically impossible usage, repair the evidence process before using the ratio for pricing or staffing decisions. A spreadsheet is useful only when its inputs describe the same real stock pool and period.
If a food-safety concern is discovered, follow the business's approved safety procedure and applicable official guidance. Do not retain unsafe material to improve closing stock, and do not reduce necessary storage or hygiene costs to create a lower percentage. A financial measure should support a sustainable restaurant, not undermine its duty to serve food safely and accurately. Mark unresolved evidence honestly and return to it with a named next action.
Sources and further checks
Sources rechecked 12 October 2026 for inventory relationships and the actual-versus-recipe distinction. The calculations, restaurants and measured-batch exercises are original fictional material. A source's broad claim that actual cost always exceeds theory is not adopted here: scope and measurement can produce a negative management variance. No restaurant stock count or valuation policy was audited.
Read our editorial and corrections policy. This guide is not audited financial advice, a legal determination or a recommendation to enter a contract.