
US & CANADA · RESTAURANT OPERATIONS
Restaurant Prime Cost Calculator: Food and Labor Explained
Calculate restaurant prime cost in USD or CAD with a fictional café example, clear cost definitions, a browser-only calculator and a repeatable weekly evidence check.
Independent educational guide. Examples are invented and independently calculated, not results from a real restaurant. Contract, accounting and jurisdiction-specific questions need the appropriate professional or official provider.
Choose a section in this guide
What prime cost tells a restaurant owner
A busy dining room can still leave very little money for rent. Prime cost brings two large operating categories together: the cost of goods sold and the full labor cost for the same period. The prime-cost ratio compares that total with restaurant revenue. It answers how much of each sales dollar is already used by the product and the people producing and serving it. It does not answer whether the whole business is profitable.
Use a consistent scope before looking for a supposedly perfect percentage. A coffee kiosk with limited preparation, a bakery making everything on site and a full-service restaurant have different work requirements. Their sales definitions can differ too. Comparing ratios without checking the underlying categories is like comparing recipes without checking the portion sizes. This guide deliberately avoids presenting one percentage as a universal rule for every US or Canadian restaurant.
Start with a completed week or month. Record the location, currency, dates, revenue basis and included labor categories at the top of the worksheet. Use USD for a US operation or CAD for a Canadian operation; changing the currency label in the calculator does not convert exchange rates. Keep tax collected for others and staff-tip liabilities separate from the restaurant-revenue basis unless your accountant's consistent reporting policy requires a different presentation.
Collect the costs before calculating
Food purchased is not necessarily food consumed. For a simple, consistently valued inventory scope, consumption begins with opening stock plus purchases minus closing stock, with documented transfers considered separately. Count beverages and other included product categories consistently. Do not improve the ratio by moving an inconvenient category out of the report halfway through the year. If your accounting policy treats packaging separately, show that choice rather than silently comparing it with a benchmark using a broader definition.
Labor should be more than the wage figure printed on a rota. Assemble actual payroll amounts for the period, the employer costs and benefits you intend to include, and any salaried allocation that belongs to the same scope. Ask the payroll provider or accountant about timing when a paycheck covers dates outside the sales week. Do not assume US payroll rules apply to Canada, or that one state or province represents the entire country.
Keep an evidence folder with the stock count, supplier invoices, payroll summary and sales report. You do not need to place employee names or customer identifiers into the public calculator. Enter totals only. Write down who checked each source and when. This small control makes it possible to distinguish an operating change from a missing invoice, an inventory recount or a payroll correction.
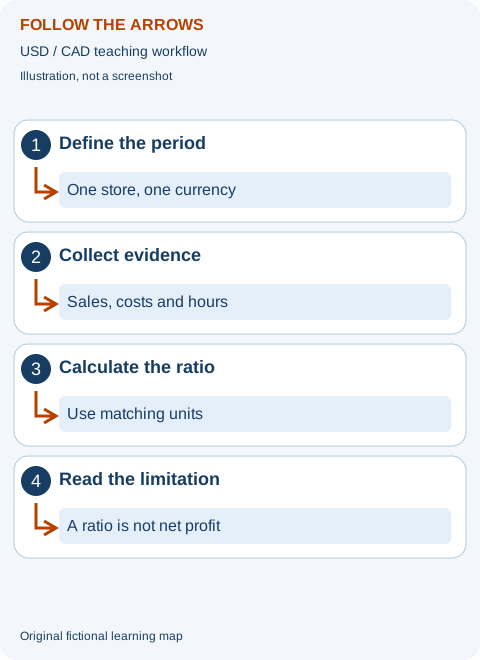
A fictional café: follow the arrows and calculate
Consider a fictional café with USD 50,000 of restaurant revenue in one month, USD 15,000 of included goods consumed and USD 17,000 of fully loaded labor. The figures are teaching assumptions, not an industry survey or a real restaurant's private results. Prime cost is 15,000 plus 17,000, or USD 32,000. Divide 32,000 by 50,000 and multiply by 100 to obtain 64%. The remaining USD 18,000 must still cover rent, utilities, software, insurance and other expenses.
Enter those three amounts in the calculator below and select USD. Press Calculate planning example. The displayed ratio should be 64.00%, with USD 32,000 of prime cost and USD 18,000 remaining before other expenses. If your Canadian café has the same numeric CAD amounts, choose CAD and repeat the calculation; it is a different monetary scenario with the same arithmetic, not a currency conversion.
Now reduce goods consumed by 1,000 while leaving revenue and labor unchanged. Prime cost becomes 31,000 and the ratio becomes 62%. That is a modelled difference of two percentage points. It does not prove you can achieve it safely or without affecting quality. A valid experiment might be measuring portion variance or fixing preventable spoilage, not cutting safe storage practices or removing necessary staff.
Read a change without blaming the wrong cause
A rising ratio has at least two sides: costs can rise, or revenue can fall. If the original 32,000 prime cost stays unchanged while sales fall to 45,000, the ratio becomes about 71.11%. No employee necessarily became slower and no ingredient necessarily became more expensive. The same resources were supporting fewer sales. Investigate the change in covers, average check, opening hours and channel mix before choosing an action.
Split the weekly discussion into goods and labor rather than arguing over one combined number. Goods variance may come from purchase prices, recipe yields, counting differences, sales mix or waste. Labor variance may come from training time, overtime, opening preparation, unexpected absence or a different service format. Document hypotheses as questions until the source evidence supports them. A ratio is a prompt for investigation, not proof of theft, poor staff effort or supplier wrongdoing.
Do not subtract payroll or ingredients twice when moving into another report. A profit-and-loss statement already includes its recorded expenses. Prime cost is a management view of selected costs, not an extra expense to add on top. Similarly, a delivery payout is not the same thing as sales for this ratio. Read the settlement reconciliation guide if a platform deposit is the only number you currently have.
Turn the calculation into a weekly routine
Choose one person to close the evidence pack after the stock and payroll checks, and one person to challenge unusual entries. Keep a short note explaining whether each week is complete or provisional. Compare like-for-like weeks and retain the original report rather than editing history to hide a correction. A monthly management review can then distinguish an actual trend from one exceptional week.
For a first experiment, select one controllable issue and define its guardrail. A preparation-yield test needs a recipe standard, a measured batch and a safety check. A scheduling test needs service-quality observations and compliance with actual employment requirements. Record both the money result and whether customers or staff experienced a problem. A lower ratio is not a successful outcome if it damages the business that creates the revenue.
Before using this model to set prices or staffing levels, ask whether the remaining amount covers all other expenses and whether the forecast has a realistic sales assumption. Use the cash-flow guide to check payment timing separately. If the evidence is incomplete, mark the result provisional and obtain the missing source. The free calculator performs arithmetic locally; it does not audit payroll, judge legal compliance or replace professional accounting review.
Begin with a completed period, not a target percentage
A beginner often asks what percentage the restaurant should achieve before understanding what the calculation includes. Reverse that order. Choose a completed week or month, one location and one currency. Write the revenue basis and the included goods and labour categories. Then collect the evidence and calculate. Only after the definitions are clear should you compare periods or consider a realistic operating objective.
For a fictional café called Maple Room, the owner prepares a one-page cover sheet. It lists the trading dates, sales source, stock count source, payroll source and reviewer. Food and beverages are consistently included in goods consumed, while packaging is shown separately under the chosen management policy. The exact policy is an assumption for this exercise. Another restaurant may choose a different consistent definition, which is why its ratio cannot automatically be compared without checking scope.
Do not use the platform payout as restaurant revenue. A payout can already include deductions and timing effects. Do not use the whole bank balance either; it can contain loans, owner funds or receipts from other periods. Start with the appropriate sales evidence and confirm its treatment with the bookkeeper. A clean-looking percentage built from the wrong denominator does not help the owner decide whether food and labour are affordable.
Mark the result provisional if important source records are missing. A payroll estimate and incomplete stock count can be useful for planning, but they are not a completed operating result. Label estimates plainly. Keep the first calculation and explain any later correction. This makes the review honest and allows another manager to understand what was known at the time.
Goods consumed: why buying stock is not the same as using it
A restaurant can buy a large delivery that lasts beyond the period. Prime cost should use the appropriate consumed-goods amount under a consistent policy, not automatically every cash payment to suppliers. The simple stock relationship starts with opening value, adds received purchases and subtracts closing value, with relevant documented movements. The stock scope, valuation and period must agree. Your accountant should decide the appropriate financial treatment.
In an original fictional week, Maple Room begins with three thousand dollars of included stock, receives five thousand and ends with thirty-five hundred. With no transfers in the exercise, consumed goods are forty-five hundred dollars. Entering purchases alone would show five thousand, overstating the selected consumption by five hundred. That is a stock timing difference, not proof that the café suddenly became more efficient or inefficient.
A count correction can change the result. If closing stock actually includes another two hundred dollars, consumption falls to forty-three hundred. Keep the correction note and its effect on the following opening balance. Do not selectively change valuations to achieve a desired ratio. The goods figure should reflect evidence, not be adjusted to fit an industry benchmark.
Link recipe and inventory questions to the actual-versus-theoretical food-cost guide. That guide investigates stock consumption against recipe-based estimates. Prime cost has a different job: combining selected goods and labour amounts against revenue. Do not add an inventory variance as a second expense if it is already inside the consumed-goods figure.
Build labour from the full stated cost, not a guessed wage
Write what your labour total includes. Wages, salaries and relevant employer costs or benefits may belong in the selected fully loaded figure. Different countries and employment arrangements require different treatment. A public calculator cannot decide lawful pay, tip allocation, payroll tax or worker classification. Use actual payroll evidence and appropriate current advice rather than assuming one US state or Canadian province represents every restaurant.
For a fictional cost-building exercise, recorded wages for the chosen period are six thousand dollars, included employer costs are six hundred and included benefits are three hundred. The selected total is sixty-nine hundred dollars. If a salary allocation of eleven hundred also belongs to the period and is not already included, the total becomes eight thousand. These invented amounts are not statutory rates or a payroll recommendation. Their purpose is to make inclusion visible.
Check the payroll period against the sales period. A paycheck date is not automatically the date the work occurred. If a payment covers more than the review week, obtain the appropriate allocation under the business's policy. Do not subtract a whole fortnight's payroll from one week's revenue merely because the bank payment happened that week. That comparison mixes a cash question with an operating-cost question.
Keep employee names out of the public learning model. Enter totals, not private payroll files. Use authorised business storage for the original evidence and restrict access appropriately. A manager who needs a cost ratio does not necessarily need every employee's personal details. Clear scope and proportionate access make the review both more understandable and safer.
A change has two sides: cost and revenue
The ratio can rise because selected costs rise, because revenue falls or because both change. Do not infer a kitchen or staffing failure from the combined percentage alone. Split the change into goods, labour and sales. Then inspect their evidence. This is a much more useful discussion than telling the team that the ratio looks bad without saying which part changed.
Take a fictional period with revenue of forty thousand dollars, goods of twelve thousand and labour of fourteen thousand. Prime cost is twenty-six thousand and the ratio is sixty-five percent. If revenue falls to thirty-six thousand while costs stay the same, the ratio becomes about seventy-two point two two percent. No cost increase occurred in this assumption. The same resources supported less revenue.
If revenue remains forty thousand but goods increase by one thousand and labour by five hundred, prime cost becomes twenty-seven thousand five hundred. The ratio becomes sixty-eight point seven five percent. That is a different problem. Check supplier and recipe changes for goods, and actual work or payroll changes for labour. A single combined ratio hides those distinctions unless the components are shown.
Write a driver note in plain language: lower revenue, higher ingredient cost, extra training hours or a count correction. Mark a hypothesis as a question until evidence supports it. Avoid blaming staff or suppliers from one preliminary figure. The review should help the owner select an action that corresponds to the actual driver.
Look at dollars and percentages together
A percentage can improve while the amount left for other expenses falls. An absolute cost can rise while the ratio improves because revenue rises faster. Both views matter. Write prime cost in money, its share of revenue and the amount remaining before other expenses. Do not call that remaining amount final profit. Rent, utilities, insurance, software and other costs still need to be covered.
For an original fictional comparison, the first period has revenue of fifty thousand and prime cost of thirty-two thousand, leaving eighteen thousand. The second has revenue of forty thousand and prime cost of twenty-four thousand, leaving sixteen thousand. The ratio improves from sixty-four to sixty percent, but fewer dollars remain. The owner still needs to know whether the other expenses are affordable and whether the lower revenue is expected.
In another case, revenue grows from fifty thousand to sixty thousand while prime cost grows from thirty-two thousand to thirty-seven thousand. The ratio falls to about sixty-one point six seven percent, and twenty-three thousand remains. The increased cost is not necessarily a failure. It may support more activity. The question is whether the increase is appropriate and whether service quality and the wider result remain acceptable.
A beginner-friendly conclusion names both outcomes. Say the ratio improved but fewer dollars remained, or costs rose while revenue rose faster. Avoid using efficient or profitable as a shortcut without the supporting wider evidence. The combined view makes it harder to celebrate a percentage that hides a weak commercial result.
Delivery, dine-in and takeaway: do not allocate shared labour casually
Different channels use common kitchen labour, ingredients and premises. A whole-restaurant prime-cost ratio does not by itself establish which channel caused a cost change. Delivery may add packaging and channel fees outside a chosen prime-cost definition. Dine-in may require different service labour. Keep the overall ratio and the channel contribution review as related but distinct methods.
Suppose a fictional restaurant has ten thousand dollars of dine-in net revenue and five thousand of delivery net revenue. Shared kitchen labour is four thousand dollars. Dividing that labour equally between channels is a management assumption, not a fact from the sales report. Allocating by revenue gives another assumption. Observed preparation work or another documented basis may be more useful for a particular decision. State the chosen method and its limits.
For a decision about additional delivery orders, focus on costs that would actually change as well as capacity. If the kitchen can fulfil a small increment with existing resources, the short-run decision may differ from a permanent expansion requiring another shift. Do not treat all labour as perfectly variable per order or perfectly fixed at every volume. Work patterns and practical capacity matter.
A whole-business prime-cost trend can prompt a channel investigation, but it should not decide the answer alone. Use a separate contribution worksheet for ingredients, packaging and relevant variable fees. Avoid subtracting labour twice when the selected decision model already includes it. Explain the purpose of each model before combining figures from them.
Opening preparation, closing work and training are real work
Some labour supports the restaurant before the first sale or after the last one. Cleaning, safe setup, preparation and closing tasks cannot be judged only against the sales occurring at the same minute. Training time also has a different purpose from immediate order fulfilment. Include work consistently in the selected period and review why it is needed before treating it as avoidable.
For an original fictional planning exercise, a shift has twenty paid team-hours: four for preparation and closing, fourteen for service and two for training. Splitting these categories can help explain the cost, but it does not make the preparation or training hours disappear. A sales-per-hour review should state which hours it uses. Comparing only service hours with an all-hours benchmark is not a like-for-like comparison.
If training increases one week's labour total, write the reason and check whether the planned training occurred effectively. Do not promise a guaranteed future saving. A new worker may require support for longer than expected, and service standards must be maintained. The question is whether the activity has a sensible purpose and whether the business can afford it, not whether every minute directly produces an order.
When considering a schedule change, preserve legal and operational requirements. A lower ratio achieved through unpaid work, unsafe preparation or inadequate service is not a legitimate improvement. Current local employment guidance and appropriate payroll advice are necessary for actual decisions. This guide supplies a learning framework, not authority to reduce required pay or staffing safeguards.
Understand a cost that changes in steps
Some costs do not rise smoothly with each sale. A small increase in orders may fit the existing roster, but a larger increase may require another shift or station. Explain this as a step: within one workload range the staffing cost is unchanged, then a new requirement adds cost. The accounting idea is discussed in OpenStax's fixed-and-variable cost introduction; the restaurant examples here are original.
Imagine a fictional incremental contribution of six dollars per order before an extra shift. Twenty additional orders contribute one hundred and twenty dollars under stable assumptions. If the extra workload requires a fully assumed one hundred dollar shift, the simplified benefit is twenty dollars before other effects. If the existing team can handle the orders properly without that extra shift, the short-run arithmetic differs. Neither case can be decided from order count alone.
Do not insert the shift cost if it is already part of a per-order labour assumption. Do not assume capacity is unlimited because the model shows positive contribution. Observe the actual bottleneck, quality and workload. A simple model should state the volume range where its assumptions are reasonable. A forecast beyond that range needs different staffing or operational assumptions.
Prime cost helps monitor the result across the full period, while an incremental model helps evaluate a particular change. They should inform each other without being mistaken for the same calculation. Clear boundaries make the analysis accessible to a new owner and reduce false confidence from a single number.
Choose one improvement with a clear guardrail
Start with an evidence-backed issue, not a demand to cut a fixed percentage. A repeated stock-count omission calls for a counting fix. A confusing recipe may call for clearer portions. Unexpected training hours may call for a better schedule or documentation. Each problem has a different remedy. Cutting purchases or hours without understanding the cause can harm the restaurant while merely shifting when a cost is recorded.
A fictional preparation test measures a representative batch and compares its usable yield with the written recipe. A staffing test reviews a comparable service period with actual hours and quality observations. A receiving test checks quantities and pack conversions. Write the question, method, responsible person and review date. Describe the outcome in both money and operating terms.
The guardrail is the thing that must not be damaged while improving cost. It may be safe preparation, accurate portions, required pay, manageable workload or customer service. If the ratio improves while one of those deteriorates, the result needs further evaluation. A financial percentage is not the sole objective of a restaurant. Sustainable service creates the revenue that the ratio depends on.
Compare similar periods and note other changes. A lower ratio after a trial does not establish that the trial caused it. Revenue, weather, holidays and menu mix can also shift. A careful conclusion might say the observed result is encouraging and another review is planned. That is more credible than a guaranteed savings claim.
Combine weeks into a month without averaging percentages incorrectly
Do not take a simple average of weekly percentages when the weeks have different revenue. Sum the compatible goods and labour amounts, sum the compatible revenue, then calculate the monthly ratio. A quiet week and a busy week should not automatically receive equal weight. Confirm the periods do not overlap and that the same cost definitions were used.
For an original fictional exercise, week one has revenue of ten thousand dollars and prime cost of seven thousand, or seventy percent. Week two has revenue of thirty thousand and prime cost of eighteen thousand, or sixty percent. The simple average is sixty-five percent, but the combined ratio is twenty-five thousand divided by forty thousand, or sixty-two point five percent. The latter reflects the different revenue weights.
Check boundary allocations for stock and payroll. A month may not consist of four identical weeks. A paycheck can cover dates outside the selected month. Use the appropriate accounting basis rather than assuming every bank payment belongs wholly to its posting week. Preserve the source allocations and explain material corrections. The calculator cannot determine them from a total.
For a management summary, state the combined result and relevant unusual events. Do not compare a partial current month with a full previous month without labelling the difference. A monthly view should make the business clearer, not conceal mismatched periods under a neatly rounded average.
Owner labour: make the management assumption visible
An owner may do substantial work that is not represented by an ordinary employee payroll line. The financial accounts and a management scenario may treat it differently. Ask the accountant about appropriate reporting. If a planning model includes an assumed replacement cost for owner work, label it separately rather than pretending it was a cash wage paid during the period.
For a fictional scenario, recorded labour is eight thousand dollars and the owner contributes work for which a management model assumes an additional fifteen hundred dollar replacement cost. The recorded and adjusted planning views differ. Both need clear labels. Do not add the assumed replacement cost to the cash forecast as if the business actually paid it, and do not remove actual payroll because the owner also helped.
This distinction can matter when deciding whether the business supports an affordable staffing structure without the owner working every shift. A café that looks comfortable only because substantial work is unpaid may require a different long-term plan. The model does not set a legal wage or guarantee a valuation. It simply makes a hidden assumption visible for discussion.
Use an appropriate professional to distinguish compensation, withdrawals and other accounting categories. A public guide should not infer them from a bank transfer. The learning point is that an owner-work assumption belongs in a clearly labelled management scenario, not silently inside an apparently factual cost total.
Use the free calculator without overestimating what it does
Begin with the three fictional defaults: revenue, goods consumed and fully loaded labour. Calculate and reproduce the sixty-four percent example by hand. The result shows selected prime cost and the amount remaining before other expenses. It does not show final profit, lawful payroll or tax liability. A result should be understandable before real business totals replace the defaults.
Change labour from seventeen thousand to eighteen thousand while holding the other fictional values constant. Prime cost becomes thirty-three thousand, the ratio sixty-six percent and remaining revenue seventeen thousand. This describes the model's arithmetic. It does not prove that a restaurant should remove one thousand dollars of labour, or that doing so would leave sales and quality unchanged.
Try a revenue-only change next. With original goods and labour but revenue of forty-five thousand, the ratio rises while prime cost stays unchanged. Explain the difference aloud. That exercise helps a new manager understand why a ratio can deteriorate without a wage or ingredient-price increase. Use one input change at a time while learning.
Select USD or CAD to label amounts already in that currency. The selector does not perform conversion. No payroll or dashboard account is connected, and entries are not saved after reload. Keep actual evidence in authorised business records. Do not enter employee names or upload private payroll files to an unrelated tool.
Interactive checks: explain the cause before choosing an action
The ratio rose while costs stayed unchanged. What happened?
Under that assumption, revenue fell relative to the same costs. Investigate the sales scope, open days, volume and mix before assigning a staffing or food-cost cause. The combined percentage alone does not prove anyone became less efficient.
Can I average two weekly percentages to get the month?
Only if the relevant weights make that appropriate. Normally sum the compatible costs and revenue, then divide. Weeks with different sales should not automatically receive equal weight. Check boundary allocations and incomplete periods too.
Does the amount remaining after prime cost equal profit?
No. Other expenses still need to be covered and appropriate accounting treatment applied. Cash timing and owner withdrawals are also separate questions. The calculator intentionally answers a limited operating-cost relationship.
A weekly review that a new manager can lead
Start by stating whether the evidence is complete. Show goods, labour, revenue and their source periods. Then describe the monetary result, percentage and remaining amount. Compare compatible periods and explain unusual corrections. This sequence is easier for a new manager than beginning with an unexplained target and trying to justify it afterward.
Choose one question to investigate and assign a practical next action. Keep unresolved evidence visible. If stock or payroll is provisional, say so. A reviewer should be able to reproduce the result from the saved source records and understand why any later version changed. Do not rewrite history to hide a count or allocation correction.
End with a clear conclusion in ordinary language: selected costs used this share of revenue, the remaining amount still has other expenses to cover, and one identified question needs further evidence. This makes the guide useful beyond arithmetic. It gives the team a shared explanation and a sensible next step without promising a universal ratio, cost saving or business result.
A price change can alter the ratio without reducing resource use
Suppose a fictional restaurant has revenue of twenty thousand dollars, consumed goods of six thousand and labour of seven thousand. Prime cost is thirteen thousand and the ratio is sixty-five percent. If the same quantities sell at higher prices and revenue rises to twenty-one thousand with unchanged goods and labour, the ratio falls to about sixty-one point nine zero percent. The restaurant did not necessarily use fewer ingredients or hours. The denominator changed.
This can be commercially useful, but it is not a guaranteed price strategy. Customer demand, item mix and service expectations may change when prices change. Fees based on selling amounts can also change outside the selected prime-cost scope. A scenario holding everything else constant is a teaching assumption, not a prediction of actual customer behaviour. Write those limitations before using the result to make a decision.
Compare the actual post-change period with suitable earlier periods and record quantities, prices and mix. If revenue rises because more expensive dishes were chosen, recipe cost may also rise. If a supplier price changes at the same time, separate that effect where the evidence permits it. Do not call every lower ratio a portion improvement. The driver needs to be named accurately.
A good management note could say that the observed ratio improved alongside higher realised revenue, while resource quantities and customer response still need review. The note should not claim a guaranteed margin increase or an unchanged demand pattern. This plain explanation is easier to understand and more truthful than a headline promising that a small price rise solves every restaurant cost problem.
Compare your own operation before comparing strangers
An external percentage can be a conversation starter, but it is not automatically a suitable target. Business format, product range, service level, included cost categories and revenue basis all matter. A bakery producing labour-intensive goods differs from a kiosk reselling prepared items. A restaurant including more employer costs differs from one reporting wages alone. The percentages can be mathematically correct yet not comparable.
Begin with your own compatible periods and evidence-backed questions. Ask whether the cost pattern supports the service being delivered and whether the remaining amount covers the wider business needs. If an external benchmark is used, record its source, date, population and definition. Do not claim a universal industry rule from one provider's marketing article.
Keep the safety and employment boundaries explicit. A comparison is not authority to reduce lawful pay, required breaks or necessary preparation standards. The owner should seek appropriate advice where the decision depends on local obligations. Prime cost is a practical operating lens, not a replacement for the responsibilities of running a restaurant.
Prime cost and contribution have different purposes
Prime cost groups selected goods and labour categories. Contribution groups costs according to how they change with the selected sales decision. Those categories need not be identical. A delivery fee may be variable but outside the chosen prime-cost definition. Some included labour may stay unchanged over a small volume range. Do not copy the same total into both models and assume the label alone changes its meaning.
For a fictional dish decision, net revenue is twenty dollars and selected variable costs total fourteen, leaving six contribution. A weekly prime-cost review instead combines the period's consumed goods and fully included labour against period revenue. The dish model can help evaluate extra orders; the period ratio can help monitor a larger resource pattern. Neither replaces the wider business accounts.
Ask what question the owner is trying to answer before selecting the model. Can this additional order contribute toward existing costs is different from how much of this month's revenue was used by goods and labour. Both are useful when definitions and assumptions are visible. Mixing them can create double-counted labour or omitted channel costs.
A new manager should explain the selected model in ordinary words and name what it leaves out. If the answer is simply it calculates profit, the purpose needs clarifying. A clear boundary makes the free tool more useful and prevents a limited operating measure from becoming an unsupported claim about the restaurant's final results.
Sources and further checks
References revisited 12 October 2026. The Toast prime-cost page did not expose article text on this recheck; the existing definition is retained as a general management relationship, not a current provider benchmark. OpenStax supports the broad contribution and cost-behaviour distinction. All restaurant cases are original and fictional, and no payroll or inventory policy was professionally reviewed.
- Toast: definition of restaurant prime cost
- OpenStax: contribution and fixed/variable cost distinctions
Read our editorial and corrections policy. This guide is not audited financial advice, a legal determination or a recommendation to enter a contract.